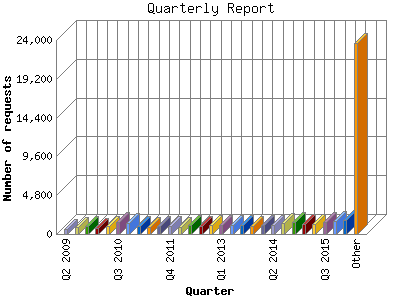
The Quarterly Report shows total activity on your site for each quarter of a
year. Remember that each page hit can result in several server requests as the
images for each page are loaded.
Note: Most likely, the first and
last quarters will not represent a complete quarter's worth of data, resulting
in lower hits.
| Quarter | Number of requests | Percentage of the requests | |
|---|---|---|---|
| 1. | Q2 2024 | 556 | 0.41% |
| 2. | Q1 2024 | 2,479 | 1.83% |
| 3. | Q4 2023 | 2,699 | 1.99% |
| 4. | Q3 2023 | 2,783 | 2.05% |
| 5. | Q2 2023 | 3,702 | 2.73% |
| 6. | Q1 2023 | 2,485 | 1.83% |
| 7. | Q4 2022 | 3,357 | 2.47% |
| 8. | Q3 2022 | 2,241 | 1.65% |
| 9. | Q2 2022 | 2,169 | 1.60% |
| 10. | Q1 2022 | 1,825 | 1.34% |
| 11. | Q4 2021 | 2,643 | 1.95% |
| 12. | Q3 2021 | 2,652 | 1.96% |
| 13. | Q2 2021 | 4,287 | 3.16% |
| 14. | Q1 2021 | 7,813 | 5.76% |
| 15. | Q4 2020 | 10,906 | 8.04% |
| 16. | Q3 2020 | 21,970 | 16.19% |
| 17. | Q2 2020 | 9,362 | 6.90% |
| 18. | Q1 2020 | 2,883 | 2.12% |
| 19. | Q4 2019 | 1,941 | 1.43% |
| 20. | Q3 2019 | 2,152 | 1.59% |
| 21. | Q2 2019 | 129 | 0.10% |
| 22. | Q1 2019 | 0 | 0.00% |
| 23. | Q4 2018 | 0 | 0.00% |
| 24. | Q3 2018 | 0 | 0.00% |
| 25. | Q2 2018 | 0 | 0.00% |
| 26. | Q1 2018 | 427 | 0.32% |
| 27. | Q4 2017 | 1,290 | 0.95% |
| 28. | Q3 2017 | 1,380 | 1.02% |
| 29. | Q2 2017 | 1,353 | 1.00% |
| 30. | Q1 2017 | 1,247 | 0.92% |
| 31. | Q4 2016 | 1,606 | 1.18% |
| 32. | Q3 2016 | 2,456 | 1.81% |
| 33. | Q2 2016 | 2,682 | 1.98% |
| 34. | Q1 2016 | 1,775 | 1.31% |
| 35. | Q4 2015 | 1,601 | 1.18% |
| 36. | Q3 2015 | 1,481 | 1.09% |
| 37. | Q2 2015 | 1,295 | 0.95% |
| 38. | Q1 2015 | 1,273 | 0.94% |
| 39. | Q4 2014 | 1,432 | 1.06% |
| 40. | Q3 2014 | 1,422 | 1.05% |
| 41. | Q2 2014 | 1,141 | 0.84% |
| 42. | Q1 2014 | 1,123 | 0.83% |
| 43. | Q4 2013 | 1,048 | 0.77% |
| 44. | Q3 2013 | 1,103 | 0.81% |
| 45. | Q2 2013 | 1,127 | 0.83% |
| 46. | Q1 2013 | 1,164 | 0.86% |
| 47. | Q4 2012 | 1,120 | 0.83% |
| 48. | Q3 2012 | 977 | 0.72% |
| 49. | Q2 2012 | 1,173 | 0.86% |
| 50. | Q1 2012 | 909 | 0.67% |
| 51. | Q4 2011 | 1,012 | 0.75% |
| 52. | Q3 2011 | 1,029 | 0.76% |
| 53. | Q2 2011 | 878 | 0.65% |
| 54. | Q1 2011 | 973 | 0.72% |
| 55. | Q4 2010 | 1,373 | 1.01% |
| 56. | Q3 2010 | 1,446 | 1.07% |
| 57. | Q2 2010 | 1,034 | 0.76% |
| 58. | Q1 2010 | 744 | 0.55% |
| 59. | Q4 2009 | 1,023 | 0.75% |
| 60. | Q3 2009 | 909 | 0.67% |
| 61. | Q2 2009 | 607 | 0.45% |
Most active quarter Q3 2020 : 21,970 requests handled.
Quarterly average: 2,380 requests handled.
This report was generated on April 23, 2024 04:49.
Report time frame April 1, 2009 22:43 to April 22, 2024 21:32.
| Web statistics report produced by: | |
 Analog 6.0 Analog 6.0 |  Report Magic 2.21 Report Magic 2.21 |